http://statnmath.blogspot.ca/2015/08/case-study-binmial-logistic-regression.html 참고하세요.
Krunnit Islands of Finland에 대한 예제입니다. 리서처들이 40년간에 걸쳐 같은 섬에 여러번 방문해서 새 종류와 그 수를 조사했습니다. 1949년 멸종위기에 처한 새를 발견했는데, 그 10년 후 1959년 그 멸종위기에 처한 새를 발견하지 못했으면 멸종이라고 간주합니다. 궁금한 점은 과연 섬 크기가 멸종에 영향을 미쳤느냐 아니냐 입니다!!
Reference : Ramsey, F.L. and Schafer, D.W. (2013). The Statistical Sleuth: A Course in Methods of Data Analysis (3rd ed), Cengage Learning. (Data from Vaisanen and Jarvinen, “Dynamics of Protected Bird Communities in a Finnish Archipelago,” Journal of Animal Ecology 46 (1977): 891-908.)
[1] Data and Model
아래 이미지에서 원래 데이타는 island, area (섬 사이즈), nspecies (1949년 각 섬마다 발견된 새 종의 수, X), nextinct (1959년 멸종된 새 종, m)까지만 있고요. 그 이후는 제가 binomial logistic regression돌린 값입니다. Response variable, Y는 nextinct 입니다.
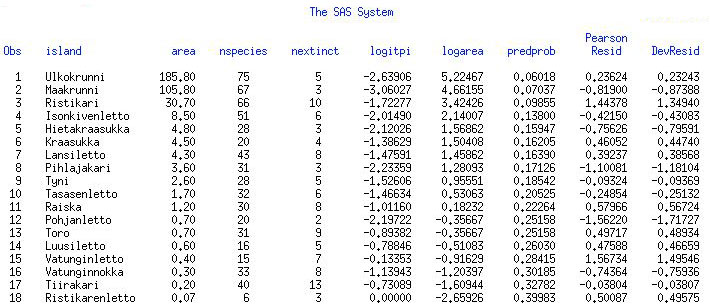
$\pi_i$ is probability of extinction of each island, assuming species survival is independent.
Then, $Y_i\sim Binomial (m_i,\pi_i)$
Observed response proportion is $\hat{\pi_i}=\frac{y_i}{m_i}$ = EXTINCT / ATRISK
Observed logit : $\log(\frac{\pi_{S,i}}{1-\pi_{S,i}})$, where S means "Saturated"
Model : $\log(\frac{\pi_{S,i}}{1-\pi_{S,i}})= \beta_0+\beta_1 \cdot AREA_i$
[2] Initial Assessment
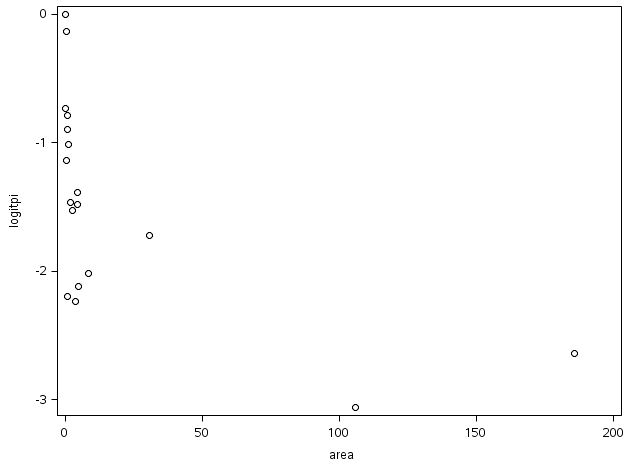
먼저 Binomial Logistic Regression에 들어가기 전, logit과 X변수간의 linear relationship이 있는지 살펴봐야합니다. 입니다!! Scatter Plot으로 logit과 area를 살펴보니 선형관계가 아니군요.
proc sgplot;
scatter y=logitpi x=area; run;
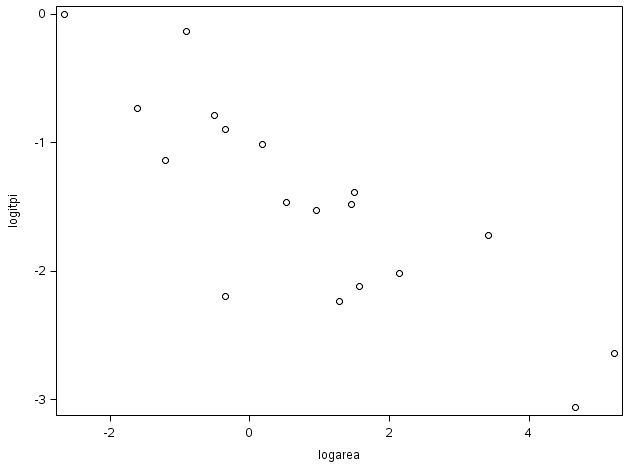
Area에 log를 취하고 다시 scatter plot을 해보니 선형관계가 보이네요. 그래서 최종 모델은 아래와 같습니다.
Our model : $\log(\frac{\pi_{S,i}}{1-\pi_{S,i}})= \beta_0+\beta_1 \cdot \log(AREA_i)$
proc sgplot;
scatter y=logitpi x=logarea; run;
[3] SAS Result
proc logistic plot(only)=effect;
model nextinct/nspecies=logarea / scale=none; run;
* scale statement shows Pearson and Deviance GOD tests
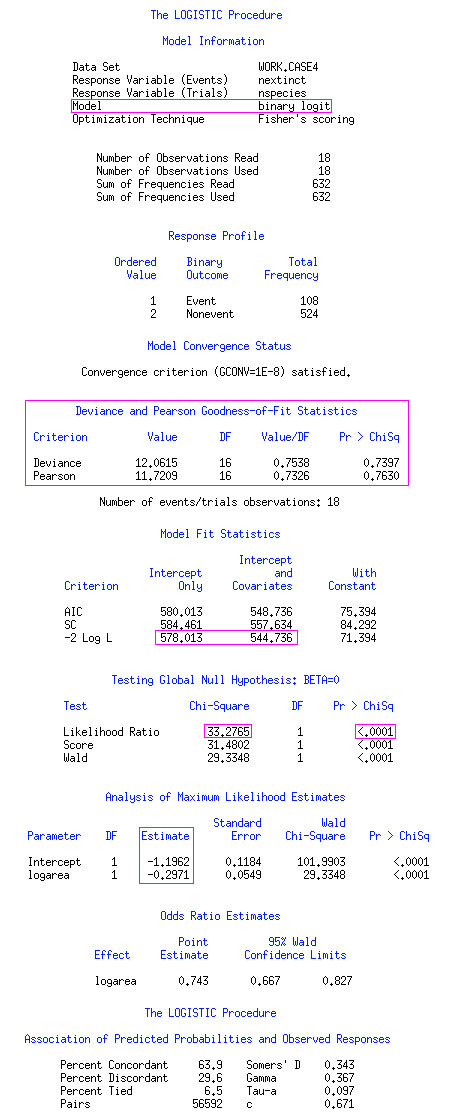
Number of observations are 18, and sum of frequencies is 632 (=$\sum_{i=1}^{18}m_i$ )
Fitted model: $logit(\hat{\pi})= - 1.196-0.297 \log(AREA)$
AREA 변수가 과연 significant 한지 알아보려면 WALD Test를 이용하면 됩니다!!
Testing Global Null Hypothesis : BETA=0 (Wald Test) (Log Area is significant?)
- Likelihood Ratio statistic is 33.2765 which is computed by 578.013 - 544.736, and the degree of freedom is 1 as we are testing only $\beta_1$.
- 결론은 P-value가 0.0001이라서 log(AREA)의 계수가 0이 아니라는거죠. 그래서 log(AREA) 변수가 logit 값을 위해 필요하다는걸 알 수 있네요.
$\beta_1$의 해석하기, 멸종확률 구하기, Deviance Goodness of Fit Test 에 대한 SAS 결과값 해석방법은 위 링크 참고하시면 정리되어 있습니다. 궁금하신 사항은 댓글 주세요 :)
참고로 Deviance GOF - reduced 모델과 full 모델 중에 어느 모델이 더 적합한지 알아보는 테스트입니다. 결과값은 링크된 곳에 정리되어 있습니다.
$H_0$: Our fitted model fits data as well as saturated model.
$H_1$: Saturated model $logit(\pi)= \beta_0+ \beta_1 I_1+...+ \beta_{n-1}I_{n-1}$ is better.
Test Statistics: Deviance = $-2 \log \frac{L_R}{L_F}=12.06$ with n-(p+1) = 18 -1 + 1 =16 d/f, p: # testing $\beta$
'공부정리 > Data Analysis 회귀분석' 카테고리의 다른 글
| adjusted R^2 & R^2값에 대해 (0) | 2017.09.19 |
|---|---|
| Log-linear Model - Contingency table 예제, 개념 및 조건 (SAS) (0) | 2015.09.01 |
| Binomial Logistic Regression (2) - Model Assessment (0) | 2015.08.22 |
| Binomial Logistic Regresion (1) - Deviance, Global Likelihood Ratio Test (2) | 2015.08.22 |
| Binary logistic regression - 이원 로지스틱 회귀 (4) 예제 Wald Test, Likelihood Ratio Test (0) | 2015.08.17 |